What every fleet manager needs to know – in a few coloured squares.
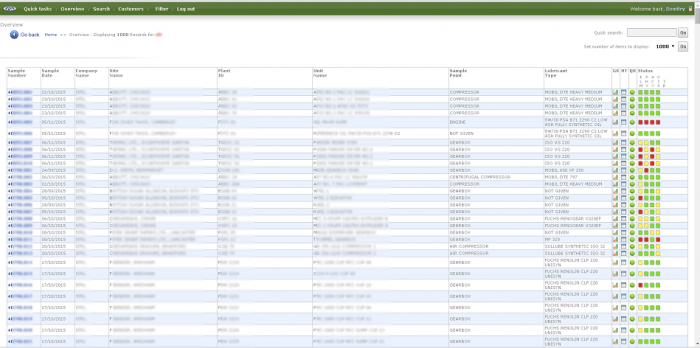
With our oil analysis web portal you can have an immediate overview of your fleet’s condition. You can see state of the last sample and when it was taken for every asset. You can trend oil analysis histories, spot patterns which lead to failure and eliminate them. Devise a tailored solution for each operational environment based on the data we give you. Keep your fleet moving and save money doing it.
If your fleet is serviced by a dealer or a third party maintenance provider you can ensure that the servicing and oil changes are carried out as agreed and your vehicles can keep on trucking. Disputes about the repair costs can also be avoided if the cause of failure has been identified.
If you maintain your fleet in-house you can use oil analysis to target your servicing to specific vehicles to improve reliability and avoid costly repairs. Save even more by safely extending oil drain intervals where the appropriate. Should a failure occur we can help you determine the cause and protect the rest of your fleet from re-occurrence.
Don’t forget to sample fuel, coolant, ad blu, gear and hydraulic oil systems.
Once you are ready to proceed please go to our Welcome page to get started or get in touch.
Package E - Engine Oils
A suite of tests to monitor viscosity, contamination and wear metal levels.
Viscosity
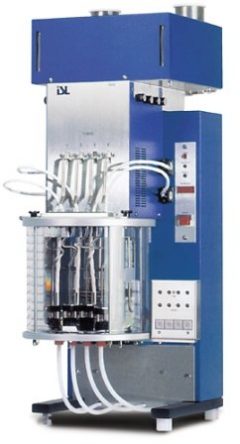 Viscosity is a measure of fluids resistance to flow. Often defined as an ISO or SAE viscosity grade (such as VG 220 or SAE 15W/40). Typically measured at 40 or 100ºC. Each application will have a viscosity range suited to the task. Too high a viscosity can lead to lubricant starvation, wear in circulating pumps, increased temperatures and reduced efficiency. If viscosity is too low, the components will not be sufficiently separated resulting in excess friction and causing wear on the machinery. A change in viscosity could be due to:
- Contamination with water/fuel/solvents/very small particles
- Oxidation or ageing of the oil
- Incorrect oil
- Mechanical shearing of the oil
Acidity or Total Acid Number
 Oil oxidises over time and becomes more acidic indicating the age of the oil. If the oil is too acidic it can damage metal components and further accelerate the ageing process. A rapid increase in the Acid Number may be due to:
- Severe oxidation (often caused by overheating)
- Depletion of additive package
- Top up with a large volume of incorrect oil with a much higher base acidity e.g. hydraulic oil
- Contamination with process fluids; or in case of engine oils with combustion products
Base Number
The build-up in acidity can be a problem in certain lubricants (mainly crankcase and engine applications due to combustion products blow by). For this application lubricants with an additive package, which provides reserve alkalinity to neutralise acids generated during combustion, are used. It is important to monitor how much of this additive package is left by checking the alkalinity of the oil – once this is depleted the oil can become very corrosive. A rapid decrease in the Base Number may be due to the possible following reasons:
- Abnormal fuel dilution
- Using high sulphur fuel
- Poor combustion
- Excessive blow by
- Severe oxidation
- Soot contamination
- Too long a drain interval
- Wrong top-up oil
- Glycol dilution
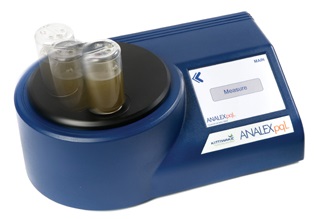
Particle Quantifier Index (PQ)
 A measure of total magnetic ferrous debris in the sample irrespective of particle size.
- Does not detect non-magnetic ferrous debris e.g. rust.
- Combine with Elemental Analysis and ISO Code for comprehensive assessment of the wear situation.
 A measure of total magnetic ferrous debris in the sample irrespective of particle size.
Elemental Analysis
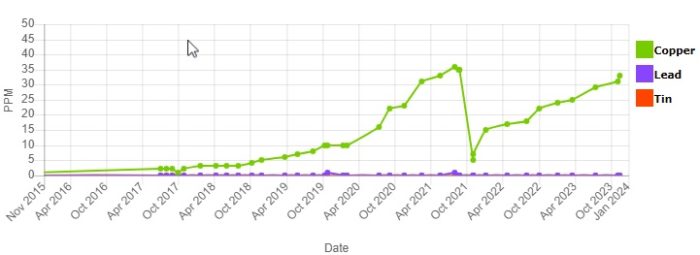
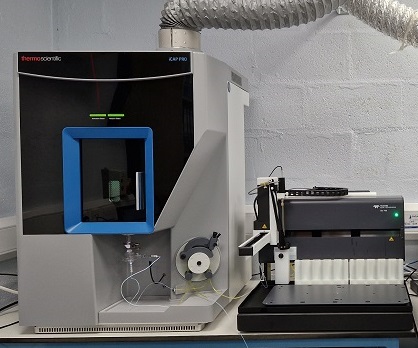 Induction Coupled Plasma Optical Emission Spectroscopy (ICP-OES) is used to measure the concentration of over 20 different elements in the oil. These include wear metals, additives and contaminants. We have recently upgraded our instrument – you can read about some of the resulting improvements here.
By monitoring wear metal concentrations the wear rate and its origin can be established. Trending additive levels ensures that the right oil is used and that it remains suitable to the task, while measuring levels of contaminants helps prevent severe wear and loss of function.
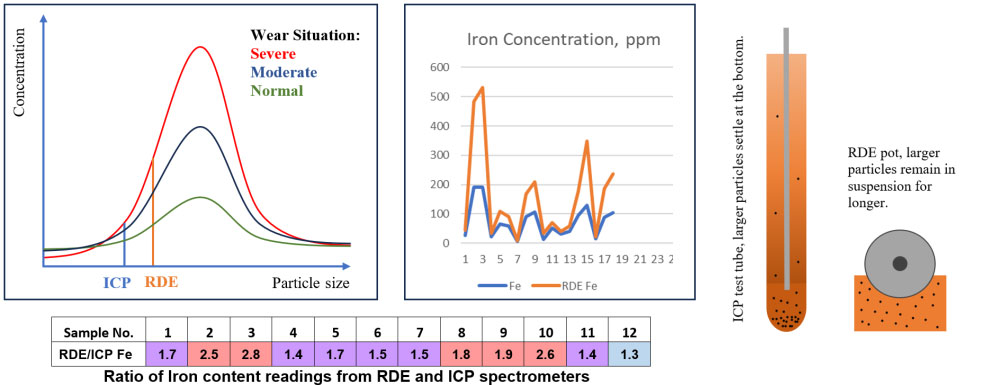
 For grease and debris samples a combination of a Rotating Disk Electrode Optical Emission Spectrometer (RDE) and an ICP-OES is used. The RDE eliminates a lot of cross-contamination issues and, as no dilution with solvents is required, allows for more accurate measurement of heavily contaminated samples which would settle at the bottom of the test tube if an ICP-OES was used. The ICP-OES is then used to cover elements not measured by the RDE (mostly additives, although the wear metals are also measured). The ratio of RDE to ICP wear metal levels gives an indication of wear particle sizes.
Water Content
 Excess water in the oil reduces the lubricating effectiveness by disrupting the oil film, accelerates corrosion (i.e. rusting of iron and steel surfaces), depletes and/or degrades additives and accelerates the aging (oxidation) of oil. Where large quantities of water are present oil may become emulsified. The emulsions can combine with insoluble oxidation products to form sludge which impairs the operation and reliability of equipment. In addition excessive water if present as free water can promote bacteria growth or form hard deposits on bearing surfaces.
An increase in water content may be due to:
- Leaking covers on equipment
- Leaking oil coolers
- Excessive leaking turbine gland steam seals
- Condensation
- Using water contaminated fluid for topping up
Flash Point (Optional)
“The flash point of a volatile material is the lowest temperature at which vapours of the material will ignite, when given an ignition source.”
In practical terms knowing the flash point is safety critical for many applications as reduced values mean increased risk of explosion or fire. Reduced flash point can indicate ingress of fuel (engines, generators), dissolution of compressed natural gas (compressors), ingress of pumped process fluids (pumps and other systems) or degradation of the lubricant (especially in thermal/heat transfer fluids and other high temperature applications).
Flash point testing can also help detect petrol in diesel fuel.
Engine sump oil in many emergency generators, lifeboat and fire pump engines suffers from fuel dilution due to intermittent running. Monitoring the flash point ensures that this safety critical kit is safe, healthy and ready to go.
Routine FTIR (Optional)
Fourier-transfer Infra Red Spectroscopy (FTIR) is a powerful tool for analysis of oil, grease and fuel samples. It is especially useful for monitoring and identifying certain types of contaminants.
The underlying principle is that infrared energy from the source is absorbed in the sample at wave lengths which are characteristic of specific molecular bonds. Each scan generates an FTIR spectrum which can be analysed and interpreted.
![]()
At its most basic the technique can be used to measure predetermined parameters, such as oxidation, nitration, sulphation or presence of fuel and glycol in an engine oil. Some of those require prior calibration and a scan of a virgin sample to be used as reference.
More advanced analysis can help monitor degradation, identify and match unknown contaminants, verify lubricant formulation or help identify and source an unknown lubricant.
In some cases Gas Chromatography coupled to Mass Spectroscopy (GC-MS) is called upon to work in tandem with FTIR analysis on particularly tricky samples, where exacting information is nonetheless required.
You can download an Example FTIR Report here.
Fuels
Sub-standard and contaminated fuel can lead to costly breakdowns, vehicles out of service and failed deliveries. Be in control of your fuel with these tests.
Viscosity
Viscosity is a measure of fluids resistance to flow. Often defined as an ISO or SAE viscosity grade (such as VG 220 or SAE 15W/40). Typically measured at 40 or 100ºC. Each application will have a viscosity range suited to the task. Too high a viscosity can lead to lubricant starvation, wear in circulating pumps, increased temperatures and reduced efficiency. If viscosity is too low, the components will not be sufficiently separated resulting in excess friction and causing wear on the machinery. A change in viscosity could be due to:
- Contamination with water/fuel/solvents/very small particles
- Oxidation or ageing of the oil
- Incorrect oil
- Mechanical shearing of the oil
Particle Quantifier Index (PQ)
- A measure of total magnetic ferrous debris in the sample irrespective of particle size.
- Does not detect non-magnetic ferrous debris e.g. rust.
- Combine with Elemental Analysis and ISO Code for comprehensive assessment of the wear situation.
Elemental Analysis
Induction Coupled Plasma Optical Emission Spectroscopy (ICP-OES) is used to measure the concentration of over 20 different elements in the oil. These include wear metals, additives and contaminants. We have recently upgraded our instrument – you can read about some of the resulting improvements here.
By monitoring wear metal concentrations the wear rate and its origin can be established. Trending additive levels ensures that the right oil is used and that it remains suitable to the task, while measuring levels of contaminants helps prevent severe wear and loss of function.
For grease and debris samples a combination of a Rotating Disk Electrode Optical Emission Spectrometer (RDE) and an ICP-OES is used. The RDE eliminates a lot of cross-contamination issues and, as no dilution with solvents is required, allows for more accurate measurement of heavily contaminated samples which would settle at the bottom of the test tube if an ICP-OES was used. The ICP-OES is then used to cover elements not measured by the RDE (mostly additives, although the wear metals are also measured). The ratio of RDE to ICP wear metal levels gives an indication of wear particle sizes.
Water Content
Excess water in the oil reduces the lubricating effectiveness by disrupting the oil film, accelerates corrosion (i.e. rusting of iron and steel surfaces), depletes and/or degrades additives and accelerates the aging (oxidation) of oil. Where large quantities of water are present oil may become emulsified. The emulsions can combine with insoluble oxidation products to form sludge which impairs the operation and reliability of equipment. In addition excessive water if present as free water can promote bacteria growth or form hard deposits on bearing surfaces.
An increase in water content may be due to:
- Leaking covers on equipment
- Leaking oil coolers
- Excessive leaking turbine gland steam seals
- Condensation
- Using water contaminated fluid for topping up
Particle Counting
 Fluid cleanliness is particularly critical for hydraulic and turbine oils. High levels of particulates, especially if the particles are abrasive (e.g. silica), can increase wear of components and lead to reduced life and premature failure. It has been demonstrated that improving cleanliness by even a couple ISO Codes can lead to doubling of the expected life of a component. Conversely, contaminated lubricant will greatly reduce component lifespan and increase costs. Fluid cleanliness is quantified by counting particles in prescribed ranges of particle sizes. It is typically expressed using an ISO 4406, a NAS 1638 or an SAE AS4059 cleanliness code. There are several ways of obtaining the particle count with the most common being instrumental particle counting and the patch test method.
Instrumental Particle Count
Most instrumental particle counters relate a change in the amount of light (either visible or laser) transmitted through the fluid into a particle count using a stored calibration. When a particle flows between the light source and the sensor, the measured output drops and this is interpreted as a particle of a certain size. Some instruments scan over a particle and are able to capture its shape and outline. Other systems measure a pressure drop as the oil is passed through a series of sieves.
Patch Test
Another approach is to pass the fluid through a filter membrane and with the aid of microscopy to either count the deposited particles or perform a comparison with reference slides. The advantage of the latter approach is that, as well as obtaining the ISO Code, the types of wear and contamination particles can be examined and captured, giving further insight into the types of wear or contamination. This method is also insensitive to air bubbles and water droplets, which can interfere with the readings of the instrumental particle counters. An example of such patches can be seen in the slideshow. At STS we have invested in a new state of the art Leica motorised microscope and camera system with a range of illumination options. We are particularly excited about Darkfield Illumination – a way to light up the patch from all sides and get better definition of difficult slides and translucent contaminants in particular.
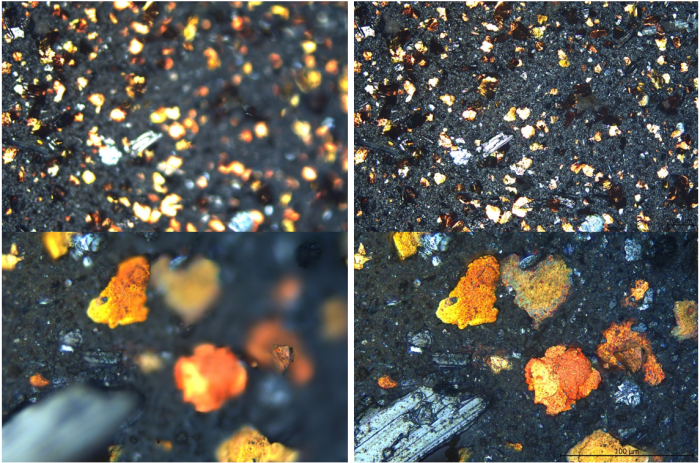
We are also enjoying the Z-stack feature – it combines in-focus areas from multiple images to achieve a single fully focused composite as shown below.
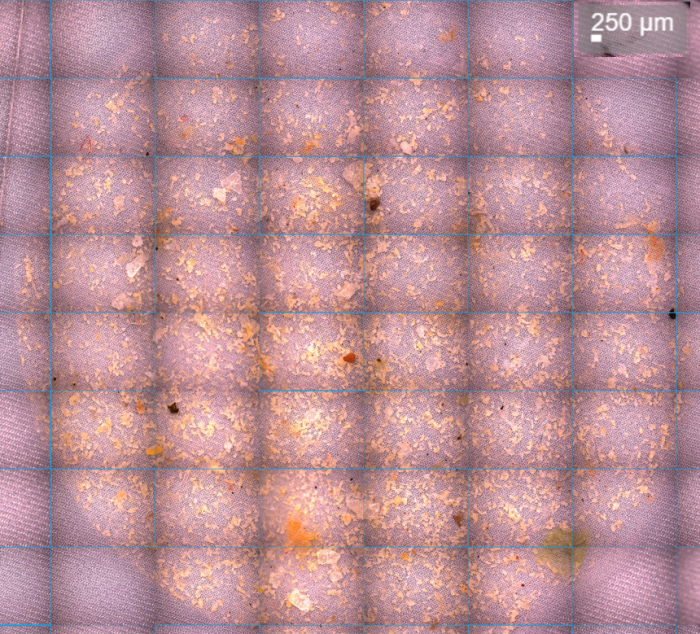
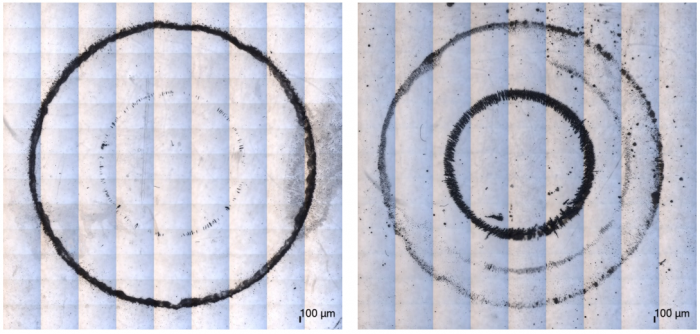
The overview/tile stitching facility lets us construct overviews of an entire membrane or ferrography slide. In the following overview we were able to use Dark Field illumination to successfully separate translucent particles from the woven 11µm membrane patch, which is also translucent.
The following overviews show differences in large (inner ring) and fine (outer ring) particle densities in two ferrography samples.
Biological Contamination*
Biological contamination of fuel tanks and large circulating oil systems (such as steam turbines, paper machines, etc) is a growing and expensive problem. Biological contamination can be in the form of bacteria, yeasts, moulds or fungi and is most likely to happen where water contamination is present, although it doesn’t necessarily take that much water – 500ppm may be sufficient. These microbes consume organic material from the oil or fuel and particularly enjoy warm temperatures, stagnant/low flow areas, an oxygen supply for accelerated growth and suspended particles to use as initial colonisation sites. These colonies can clog control systems, degrade oil quality and performance and produce corrosive byproducts. They can block filters and, in the case of contaminated diesel (where it may be referred to as Diesel Bug), fuel injectors.
We can check your samples for evidence of biological contamination. Water is used to extract potential contaminants from the oil/fuel sample. This is then deposited onto a dip slide with growth medium. The slides are incubated for a week and checked for colonies of bacteria, yeasts and moulds. Each sample is run in duplicate to avoid false positives and a clean water blank is tested to ensure no water-borne contamination is introduced.
If biological contamination is discovered, you will need to consider flushing and cleaning the system, as well as adding a suitable biocide into the fresh oil charge. It is also important to take steps to minimise future ingress of water and other contaminants.

Flash Point (Petrol in Diesel)
“The flash point of a volatile material is the lowest temperature at which vapours of the material will ignite, when given an ignition source.”
In practical terms knowing the flash point is safety critical for many applications as reduced values mean increased risk of explosion or fire. Reduced flash point can indicate ingress of fuel (engines, generators), dissolution of compressed natural gas (compressors), ingress of pumped process fluids (pumps and other systems) or degradation of the lubricant (especially in thermal/heat transfer fluids and other high temperature applications).
Flash point testing can also help detect petrol in diesel fuel.
Engine sump oil in many emergency generators, lifeboat and fire pump engines suffers from fuel dilution due to intermittent running. Monitoring the flash point ensures that this safety critical kit is safe, healthy and ready to go.
FTIR Spectroscopy
Fourier-transfer Infra Red Spectroscopy (FTIR) is a powerful tool for analysis of oil, grease and fuel samples. It is especially useful for monitoring and identifying certain types of contaminants.
The underlying principle is that infrared energy from the source is absorbed in the sample at wave lengths which are characteristic of specific molecular bonds. Each scan generates an FTIR spectrum which can be analysed and interpreted.
![]()
At its most basic the technique can be used to measure predetermined parameters, such as oxidation, nitration, sulphation or presence of fuel and glycol in an engine oil. Some of those require prior calibration and a scan of a virgin sample to be used as reference.
More advanced analysis can help monitor degradation, identify and match unknown contaminants, verify lubricant formulation or help identify and source an unknown lubricant.
In some cases Gas Chromatography coupled to Mass Spectroscopy (GC-MS) is called upon to work in tandem with FTIR analysis on particularly tricky samples, where exacting information is nonetheless required.
You can download an Example FTIR Report here.
Biodiesel Content - FAME
Fatty Acid Methyl Ester (FAME) is the primary constituent of biodiesel. A certain percentage of FAME in forecourt diesel fuel is allowed (currently up to 7%), however not all engines are able to cope with greater concentrations. Determining the biodiesel content of the fuel may be necessary to diagnose engine failure. Some of the problems caused include “corrosion of fuel injection components, low-pressure fuel system blockage, increased dilution and polymerisation of engine oil, pump seizures due to high fuel viscosity at low temperature, increased injection pressure, elastomeric seal failures and fuel injector spray blockage”.
Distillation
Distillation is a technique for characterising petroleum fractions and products. It can be used to verify if a fuel sample matches the expected type. Modern techniques utilise Gas Chromatography to simulate the distillation process reducing time and cost.
Petrol to EN228
In many cases a selection of carefully chosen tests will be sufficient to identify specification failure due contamination or misfuelling. In some cases however it is necessary to conduct full specification testing. EN228 is a standard that defines the properties that petrol must meet to be sold in the EU. The corresponding test suite comprises the following tests:
- Appearance Visual
- RON EN ISO 5164
- MON EN ISO 5163
- Lead content EN 237
- Density EN ISO 12185
- Sulphur content EN ISO 20846
- Oxidation Stability EN ISO 7536
- Distillation EN ISO 3405
- Existent Gum (washed) EN ISO 6246
- Copper Corrosion EN ISO 2160
- HydrocarbonTypes (Aromatics & Olefins) EN 15553
- Benzene Content EN 238
- Oxygenates (oxygen content) EN 13132
- Vapour Pressure EN 13016-1
- VLI Calculation (if required) N/A
- Manganese EN 16135 (ASTM D3831)
Diesel to EN590
In many cases a selection of carefully chosen tests will be sufficient to identify specification failure due contamination or misfuelling. In some cases however it is necessary to conduct full specification testing. EN590 is a standard that defines the properties that diesel fuels must meet to be sold in the EU. The corresponding test suite comprises the following tests:
- Cetane number / Derived cetane – EN ISO 5165 / IP 498
- Cetane Index – EN ISO 4264
- Density at 15ºC – EN ISO 12185
- Polycyclic aromatic hydrocarbons – EN 12916
- Sulphur content – EN ISO 20846
- Flash point – EN ISO 2719
- Carbon residue on 10% residue – EN ISO 10370
- Ash – ISO6245
- Water content – EN ISO 12937
- Total contamination – EN 12662
- Copper corrosion – EN ISO 2160
- FAME content – EN 14078
- Oxidation stability – EN ISO 12205
- Oxidation stability* – EN 15751
- Lubricity – ISO 12156-1
- Kinematic viscosity at 40ºC – EN ISO 3104
- Distillation – EN ISO 3405 CFPP EN 116
- Manganese – EN 16576
- F.B.T – IP 387 procedure b
* = Required if F.A.M.E > 2.0 %
Coolants
Using incorrect coolant can lead to corrosion, overheating, leaks and other problems. Monitor coolant condition with the following tests.
Viscosity
Viscosity is a measure of fluids resistance to flow. Often defined as an ISO or SAE viscosity grade (such as VG 220 or SAE 15W/40). Typically measured at 40 or 100ºC. Each application will have a viscosity range suited to the task. Too high a viscosity can lead to lubricant starvation, wear in circulating pumps, increased temperatures and reduced efficiency. If viscosity is too low, the components will not be sufficiently separated resulting in excess friction and causing wear on the machinery. A change in viscosity could be due to:
- Contamination with water/fuel/solvents/very small particles
- Oxidation or ageing of the oil
- Incorrect oil
- Mechanical shearing of the oil
Particle Quantifier Index (PQ)
- A measure of total magnetic ferrous debris in the sample irrespective of particle size.
- Does not detect non-magnetic ferrous debris e.g. rust.
- Combine with Elemental Analysis and ISO Code for comprehensive assessment of the wear situation.
Elemental Analysis
Induction Coupled Plasma Optical Emission Spectroscopy (ICP-OES) is used to measure the concentration of over 20 different elements in the oil. These include wear metals, additives and contaminants. We have recently upgraded our instrument – you can read about some of the resulting improvements here.
By monitoring wear metal concentrations the wear rate and its origin can be established. Trending additive levels ensures that the right oil is used and that it remains suitable to the task, while measuring levels of contaminants helps prevent severe wear and loss of function.
For grease and debris samples a combination of a Rotating Disk Electrode Optical Emission Spectrometer (RDE) and an ICP-OES is used. The RDE eliminates a lot of cross-contamination issues and, as no dilution with solvents is required, allows for more accurate measurement of heavily contaminated samples which would settle at the bottom of the test tube if an ICP-OES was used. The ICP-OES is then used to cover elements not measured by the RDE (mostly additives, although the wear metals are also measured). The ratio of RDE to ICP wear metal levels gives an indication of wear particle sizes.
Glycol Content and Freezing Point
We use a refractometer to measure levels of Ethylene Glycol and therefore the Freezing Point of the coolant mixture.
Particle Counting (Optional)
Fluid cleanliness is particularly critical for hydraulic and turbine oils. High levels of particulates, especially if the particles are abrasive (e.g. silica), can increase wear of components and lead to reduced life and premature failure. It has been demonstrated that improving cleanliness by even a couple ISO Codes can lead to doubling of the expected life of a component. Conversely, contaminated lubricant will greatly reduce component lifespan and increase costs. Fluid cleanliness is quantified by counting particles in prescribed ranges of particle sizes. It is typically expressed using an ISO 4406, a NAS 1638 or an SAE AS4059 cleanliness code. There are several ways of obtaining the particle count with the most common being instrumental particle counting and the patch test method.
Instrumental Particle Count
Most instrumental particle counters relate a change in the amount of light (either visible or laser) transmitted through the fluid into a particle count using a stored calibration. When a particle flows between the light source and the sensor, the measured output drops and this is interpreted as a particle of a certain size. Some instruments scan over a particle and are able to capture its shape and outline. Other systems measure a pressure drop as the oil is passed through a series of sieves.
Patch Test
Another approach is to pass the fluid through a filter membrane and with the aid of microscopy to either count the deposited particles or perform a comparison with reference slides. The advantage of the latter approach is that, as well as obtaining the ISO Code, the types of wear and contamination particles can be examined and captured, giving further insight into the types of wear or contamination. This method is also insensitive to air bubbles and water droplets, which can interfere with the readings of the instrumental particle counters. An example of such patches can be seen in the slideshow. At STS we have invested in a new state of the art Leica motorised microscope and camera system with a range of illumination options. We are particularly excited about Darkfield Illumination – a way to light up the patch from all sides and get better definition of difficult slides and translucent contaminants in particular.
We are also enjoying the Z-stack feature – it combines in-focus areas from multiple images to achieve a single fully focused composite as shown below.
The overview/tile stitching facility lets us construct overviews of an entire membrane or ferrography slide. In the following overview we were able to use Dark Field illumination to successfully separate translucent particles from the woven 11µm membrane patch, which is also translucent.
The following overviews show differences in large (inner ring) and fine (outer ring) particle densities in two ferrography samples.
pH
Testing a coolant’s pH level will indicate its acidity or basicity. pH is a measured on a standard scale from 1 to 14. Values above 7 are considered alkaline and values below 7 are acidic. Inhibitor additives are added to coolant formulations typically maintaining pH between 7.5 and 10. This prevents corrosion of the cooling system components.
Ad Blu
Contamination with diesel or engine oil is quite common and can cause severe problems. Check the condition of your Ad Blu to avoid costly failure.
Adblue Test Suite
Adblue is used as a consumable in selective catalytic reduction in order to lower NOx concentration in the diesel exhaust emissions from diesel engines. It is an aqueous urea solution made with 32.5% urea and 67.5%. Or at least it should be. Poor fluid handling practices mean that contamination is common. Elemental Analysis, Appearance Check, Urea Content, Density, Refractive Index and Hydrocarbon Content Measurements are used to check Adblue condition and contamination levels.